School-Based Weather Station Network
Greater Victoria
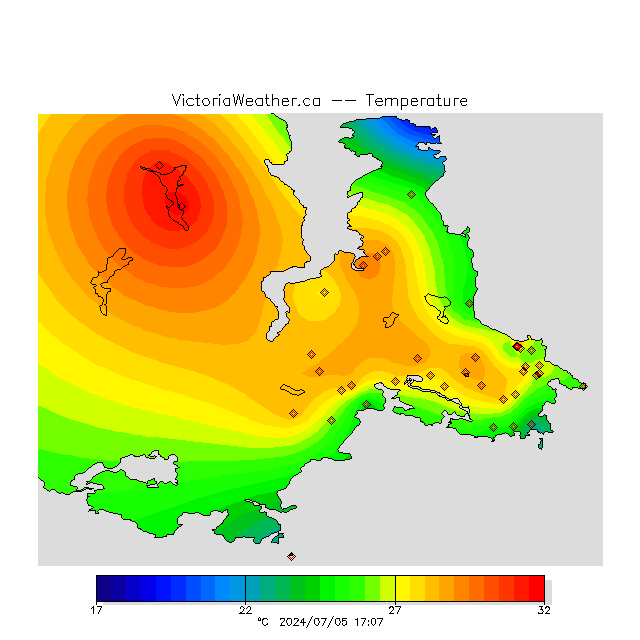
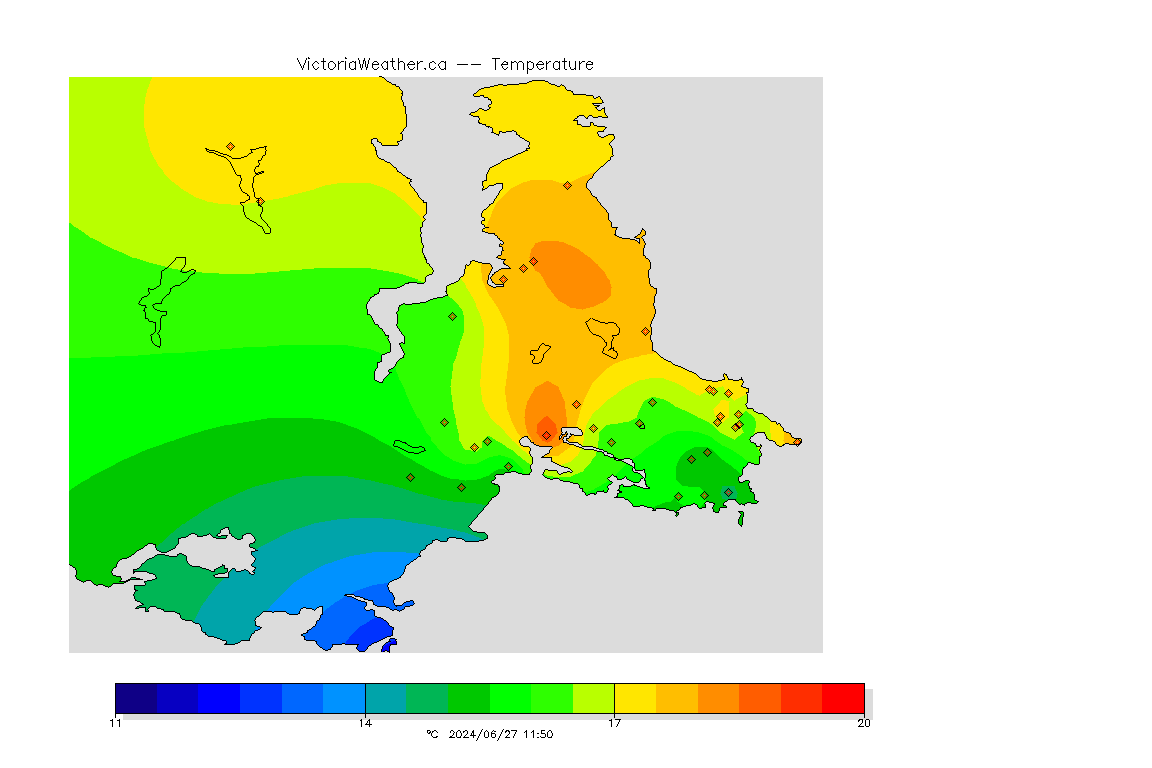
Temperature at our weather stations (25/166).
Place your mouse over a station (diamond) to see the current temperature at that location.
Other variables can be found on our two-dimensional plot page.
See Victoria. A large version of the temperature map is also available. See also: NanaimoWeather.ca, IslandWeather.ca.
Stations in the Network
|
Victoria West Elementary School
The highest temperature ever recorded was 58°C at Al Aziziyah, Libya, on 13 September, 1922. |
All Stations, One VariableSee plots for a single variable at all of the stations in the network. Recent ObservationsSee a graphical summary of the latest observations across the entire network. |
Contact information
For further information or data inquiries please contact Ed Wiebe at ecwiebe at uvic.ca. If you find a problem or have a question about the site please be sure to send the relevant site and page address (the URL from your browser's address bar). Also include a screen capture image if you can so that we can see what you are seeing.

